
Discover the best TradingView tools for DYOR on EXMO.com
EXMO.com always tries to empower traders with valuable insights and cutting-edge tools. In this article, we’ll dive into the world of DYOR and explore the best tools offered by TradingView. Get ready to enhance your trading strategies and make informed decisions like a pro!

Understanding the Importance of DYOR
At the EXMO.com platform, we believe in the fundamental principle of DYOR (Do Your Own Research).
Conducting thorough research is vital for any trader looking to succeed in the fast-paced crypto market. By arming yourself with reliable information, you can minimise risks and maximise your potential profits.
What is TradingView
TradingView is a renowned platform that empowers traders with comprehensive charting tools, technical analysis indicators, and a vibrant community. It has become an indispensable resource for traders of all skill levels, providing access to real-time market data and actionable insights.
Charting tools for precise analysis
TradingView offers a wide range of charting tools that enable you to analyse price movements with precision. From customisable indicators and drawing tools to multiple chart types, you can create insightful visual representations that facilitate better decision-making. There are nine different charts available: from Bars and Candles to Heinkin Ashi and Baseline. Bitcoin’s price looks cool on each of them.
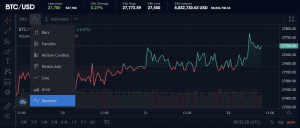
Baseline chart type.
Time intervals are conveniently located both at the top and bottom of the interface. To view a four-hour chart, simply select “4 hours” from the dropdown menu of the Time interval icon. For a specific time frame, utilise the calendar option at the bottom. Click on the Calendar icon and select your desired timeframe.
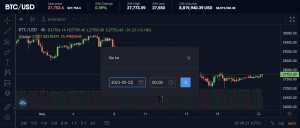
Choose your timeframe by clicking on the Calendar icon.
Besides this, you can also change the default type of cursor (a cross, a dot or an arrow) on the chart by clicking on the cross icon, located at the top of the drawing tools. Also, you can easily draw on the chart by simply clicking on the drawing instruments located on the right-hand side of the charting screen.
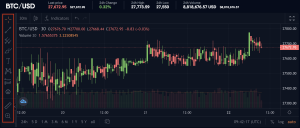
Draw on the chart by using drawing instruments.
Technical analysis indicators
Raise your trading strategies to the next level with TradingView’s extensive collection of technical analysis indicators. Whether you’re a fan of moving averages, Bollinger Bands, or MACD, TradingView has you covered. These indicators provide valuable insights into market trends, helping you to identify potential entry and exit points.
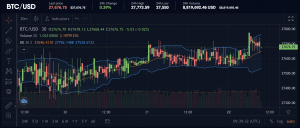
This is how Bollinger Bands indicator looks like on TradingView.
Social trading and idea sharing
Engage with a vibrant community of traders on TradingView by exploring social trading features. Discover trading ideas, follow experienced traders, and share your own insights. Collaborate with like-minded individuals and gain valuable perspectives to refine your strategies.
Real-time market data
TradingView’s real-time market data is a game-changer for traders. Stay up to date with live price feeds, volume data, and market depth information. This data empowers you to make timely decisions based on the most accurate and current market conditions.
Integration with EXMO.com
At EXMO.com, we recognise the value of TradingView and its immense potential for our traders. That’s why we have seamlessly integrated TradingView’s powerful tools directly into our platform. Access advanced charting, technical analysis, and community insights, all within the EXMO.com ecosystem.
With the power of TradingView’s tools and the convenience of EXMO.com’s integrated platform, you have everything you need to embark on your trading journey with confidence. Remember to always do your own research, leverage valuable insights provided by TradingView, and make informed decisions.