
What is cryptocurrency candlestick analysis
Since the cryptocurrency market is still relatively young, it has not yet achieved a high level of efficiency. Therefore, price movements on charts primarily depend on the sentiment of market participants.
Candlestick analysis is an indispensable tool in helping you predict asset price changes based on historical data.
The basics of candlestick patterns were introduced by Munehisa Homma, an 18th-century Japanese rice trader. He believed that the ideal price change chart should be also handy for analysis. Today, Japanese candlesticks are the most popular way to quickly analyse price movements among traders.
The top 9 single candlestick patterns
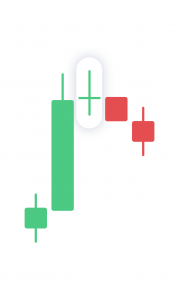
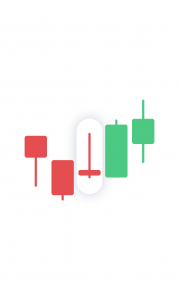
This pattern indicates equal confrontation between buyers and sellers and the state of indecision on the market. Often, the neutral Doji is followed by a short-term price reversal.
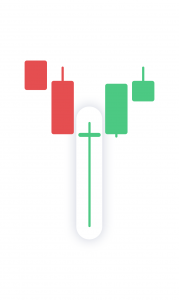
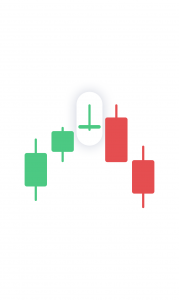
It is observed when the high, opening and closing prices are equal or close in value, while the low of the period is considerably lower. This pattern may indicate a reversal of a downtrend.
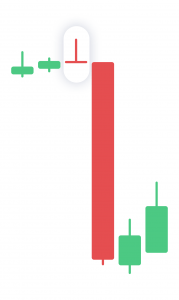
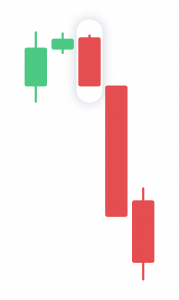
It represents the upcoming trend reversal from bullish to bearish when sellers are stronger than buyers. Such a candle is often followed by a sharp decrease in price action.
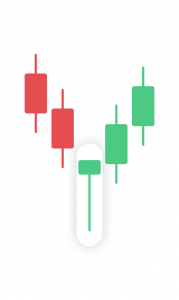
Like the Doji candle, it can indicate that an asset is oversold, and a trend reversal is about to take place.
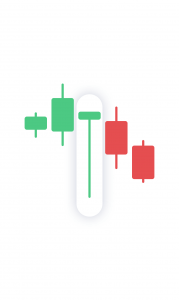
The candlestick pattern resembles the shape of an inverted Hammer and indicates a possible trend reversal from a bearish to bullish.
Unlike the Hammer pattern, it occurs during a bullish market and indicates possible reversal from an uptrend to a downtrend.
This pattern basically resembles a Shooting Star which is flipped upside down. It occurs at the end of a bullish trend and indicates the beginning of the bearish one.
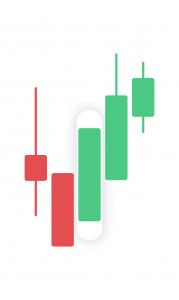
It shows buyers’ confidence in the market, as well as suggests that the asset price will follow this pattern for a short period until it reaches the resistance level.
It shows consumer confidence in the market, as well as suggests that the asset price will follow this pattern for a short period until it reaches the support level.
